Activity 17: Basic Video Processing
Videos are becoming common with the advent of the digital era. Almost anyone can create their own videos. We can take advantage of this technology in exploring physics by performing experiments and monitor certain variables as a function of time.
A video is simply a string of still images flashed one after the other. The rate at which the video is captured is called the frame rate (measured in frames per second, fps). The higher the frame rate, the higher quality of the image in terms of smoothness of motion and time resolution. In our case, we used Cole’s web camera that can capture videos to see the dynamics of a physical pendulum (as opposed to a simple pendulem). His camera has frame rate of 15fps and, by Nyquist criterion, we can only resolve harmonic motion with frequency of less than 8Hz.
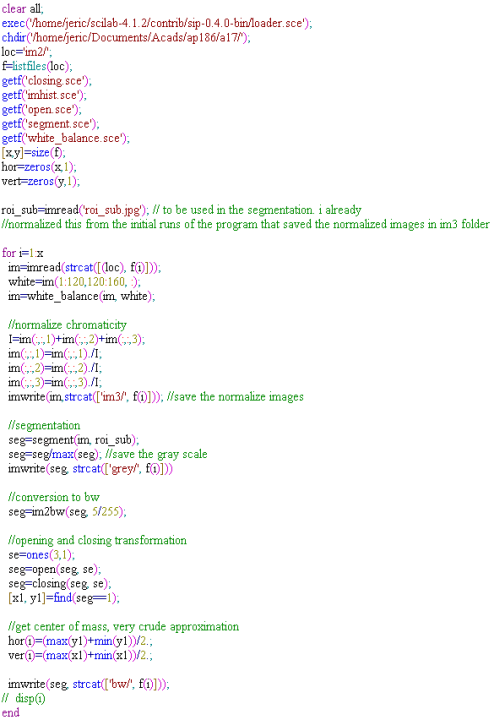
In this activity our group (me, cole and mark) decided that we want to invsitigate the period of a physical pendulum and compare it with theoretical predictions. For the first part, we captured video from the web cam and converted the frames to image files in *.jpg format (using avidemux) with the same fps but with reduced images size to 120 by 180 (from the original 480 by 720). The images were then subject to white balancing, chromaticity normalization, image segmentation (using color), binarization (using grayscale histogram), and opening and closing transformation. Basically we applied here everything we did for the entire sem. :). Assumptions regarding the ruler include homogeneity in the density of the ruler, the pivot is at excatly at the edge, and that the center of mass located exactly in the middle of the ruler.

Here is the gif animation i made (i converted the images to gif animation to avoid problems with the UP blocking access to video sharing sites such as youtube). The left is the orginal set of images, the middle are the normalized ones and the last are the binarized images. The gif is quite large (1.6mb) but once it gets loaded, it keeps on rolling. 🙂 I also ensured the the speed of the gif is similar to the fps of the camera used.
A physical pendulum is a more generalized pendulum with no ideal strings. The period of oscillation of this pendulum is given by

where I is the moment of inertia about the pivot and L is the distance of the center of mass from the pivot. 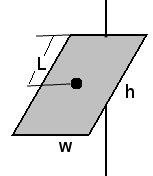
For our ruler with length h and width w with pivot around the end the moment of inertia is given by

The period of oscillation can be obtained from the graph by plotting the location of the center of mass as a function of time and getting the distance between two peaks.If this is what we use, we get a period of 1.2 sec
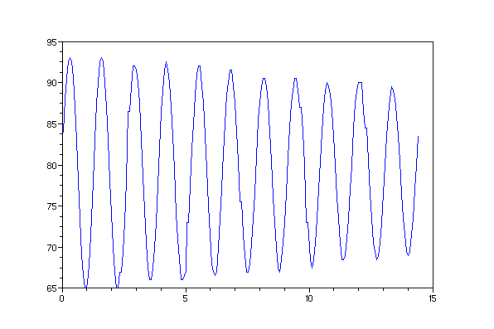
I also used fft to get the dominating frequency of our signal above, and found it to 0.769 Hz or a period of around 1.3 sec which is not far from the above. I also believe that the frequency obtained by fft is more accurate than just picking peaks. 🙂
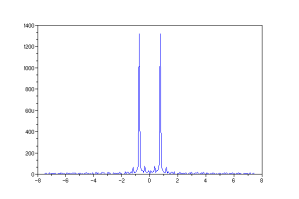
Theoretically, this ruler with mass 174.8g, length of 63.5cm and width of 3cm would have a period of oscillation of 1.31s (the moment of inertia being 0.0235). This means we have error of only 0.76%. This is very near the expected value , considering that the we had a few assumptions regarding this ruler.
-oOo-

-oOo-
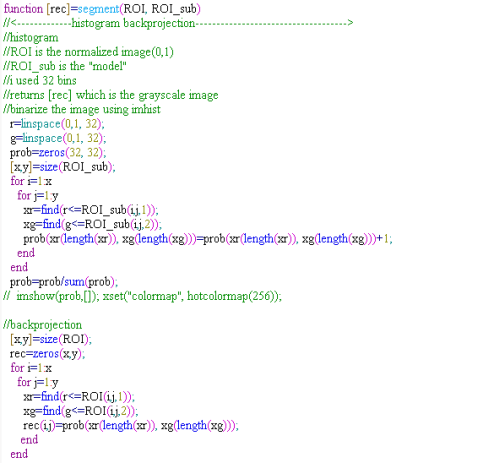
Here are the functions i made that were invoked above.
closing.sce

open.sce

imhist.sce

segment.sce
white_balance.sce

-oOo-
Collaborators: Mark, Cole
I want to give myself a 10 here because i believe I was able to complete what has to be done by applying almost everything we had learned.:)
Leave a comment